Role
Senior Product Designer
Scope
Design, Hypothesis Development, Experiment Design & Reporting
Impact
+1.3K organic installs weekly
Date
Fy25
Problem
Approach
I logged into the experimentation tool and quickly figured out what was technically feasible in terms of targeting, authoring, design, and experimentation. Assessing banner performance across all areas of the mobile site, I identified the top 10 most trafficked (and most impactful) areas to run experiments on. After designing and building an improved UI with added space for compelling messaging, I worked with multiple squads and marketing teams to develop hypotheses, define primary and secondary metrics, and align on new copy variations for experimentation on different steps in the user journey.
Value delivered
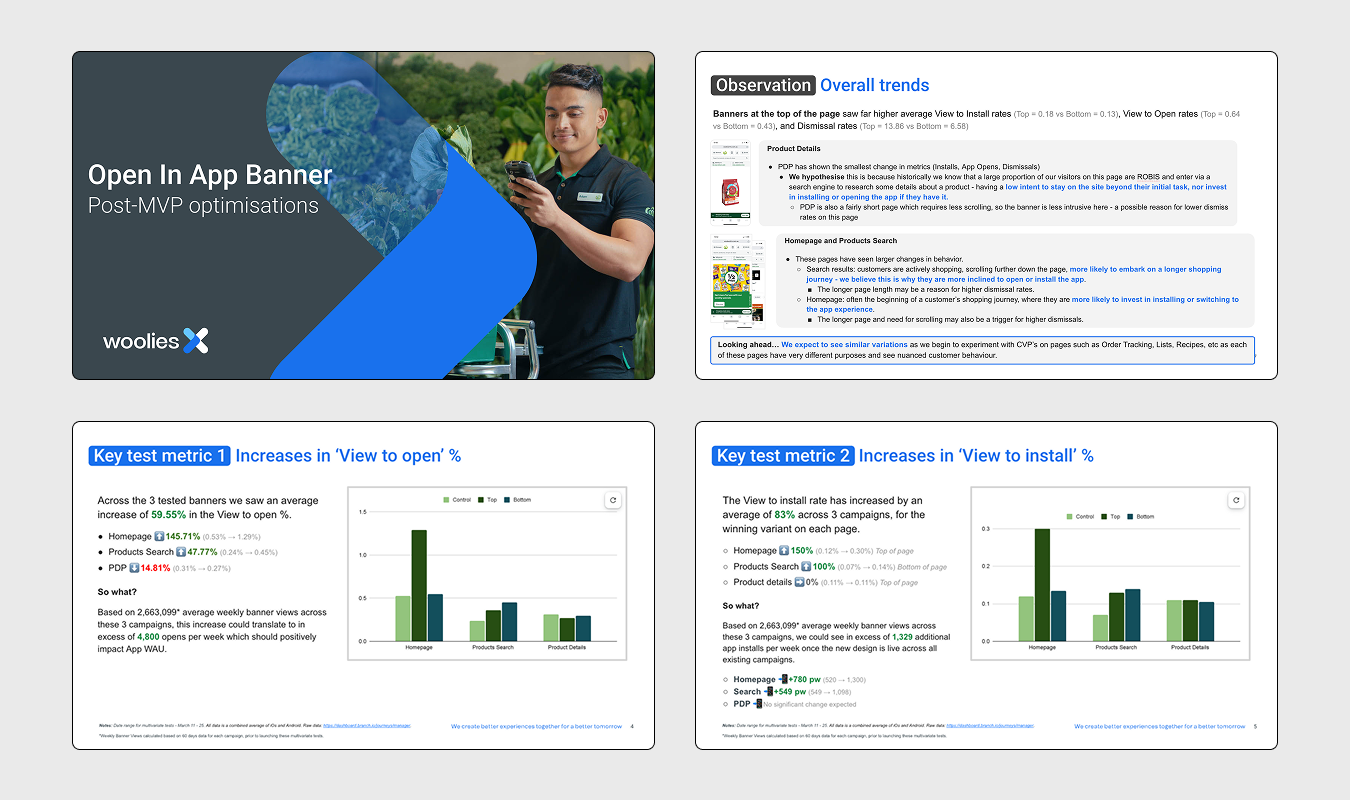
The work I did resulted in a 2-phased approach that delivered significant improvements to key metrics. Phase 1, switching from the old pill-shaped banner to the new design, resulted in an average increase of 59.55% in the View to open %, and the View to install rate increased by an average of 83%. Phase 2, experimenting with copy variations based on which step in the user journey the banner was seen, resulted in an average increase of 73% in the View to open %, and the View to install rate increased by an average of 92%. Based on the number of weekly banner views across the 10 campaigns tested, Woolies could see in excess of 1,300 additional organic app installs per week, saving them significant dollars on customer acquisition.
Actual experience + process
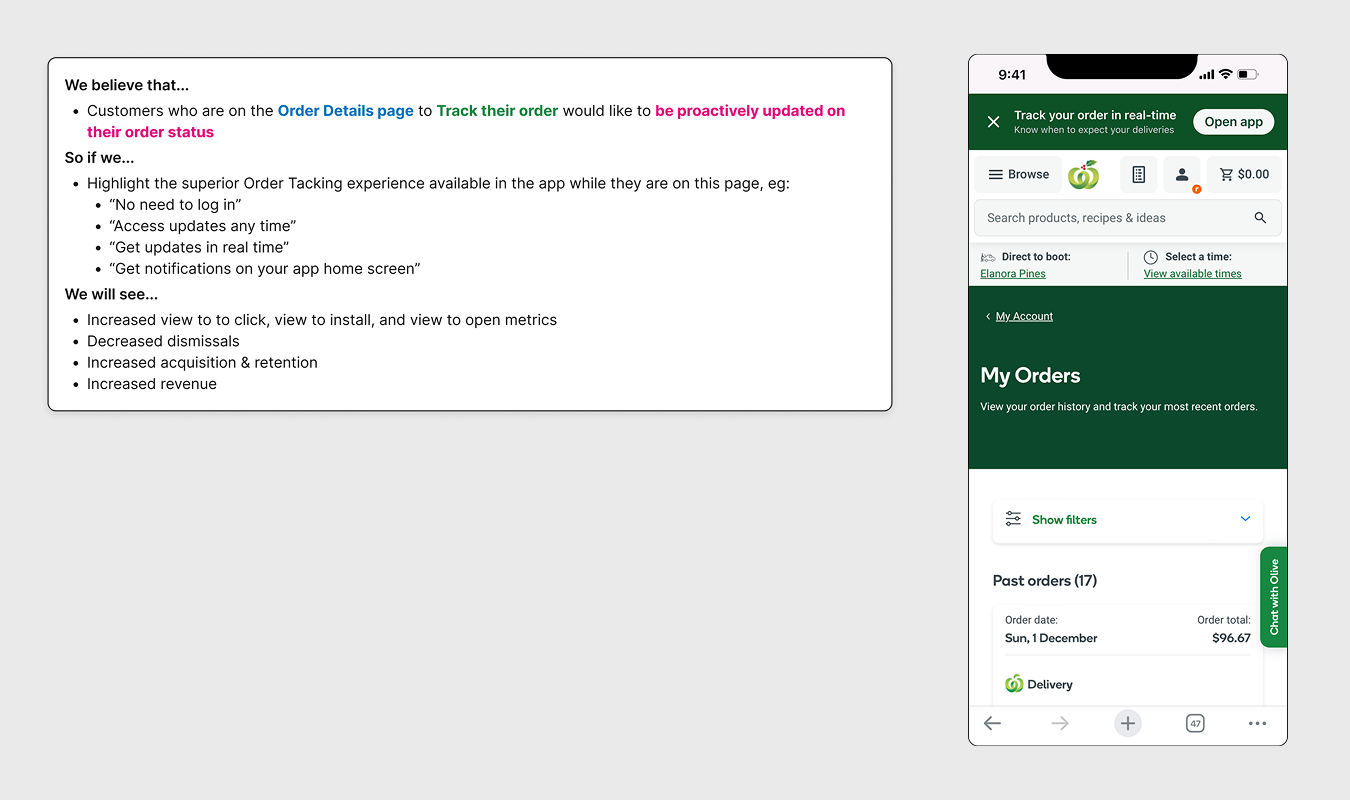
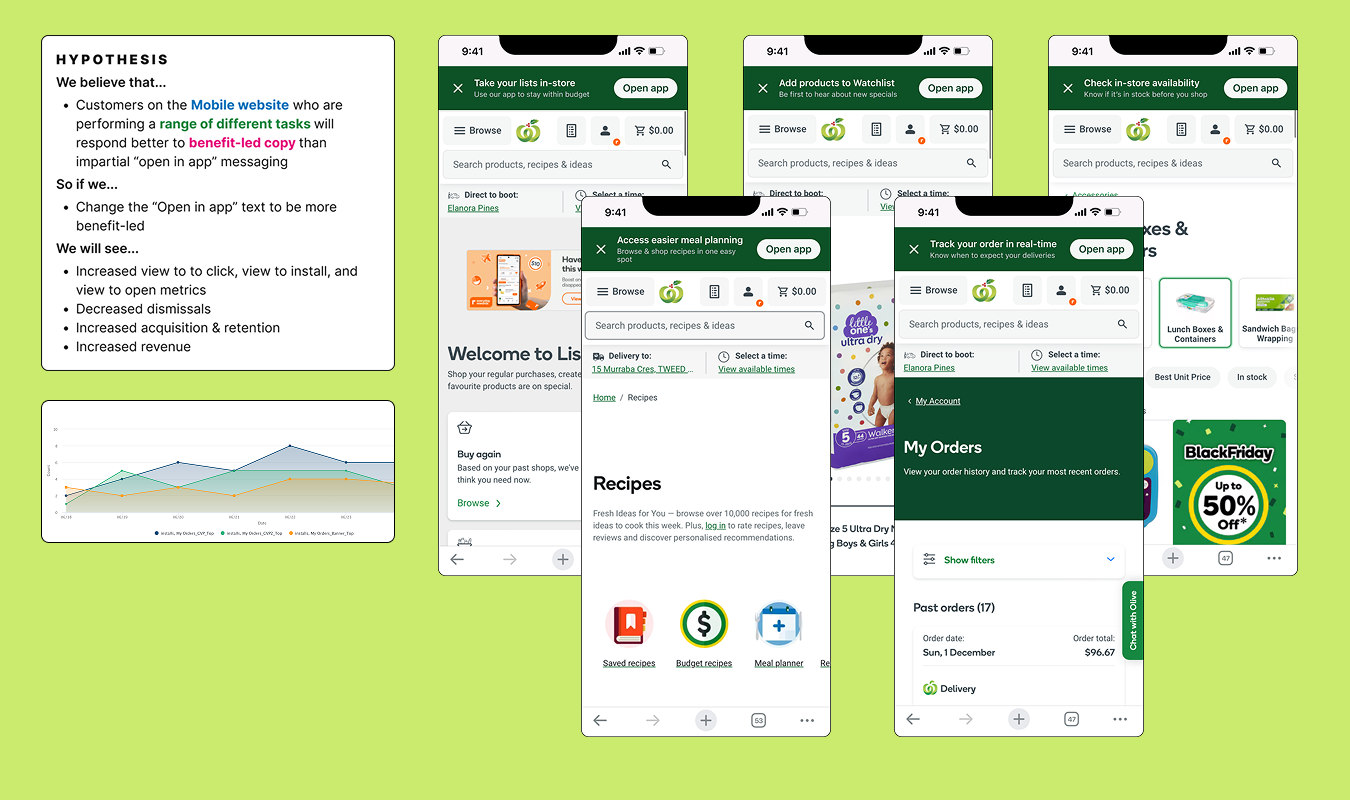
Hypothesis development for top-trafficked pages
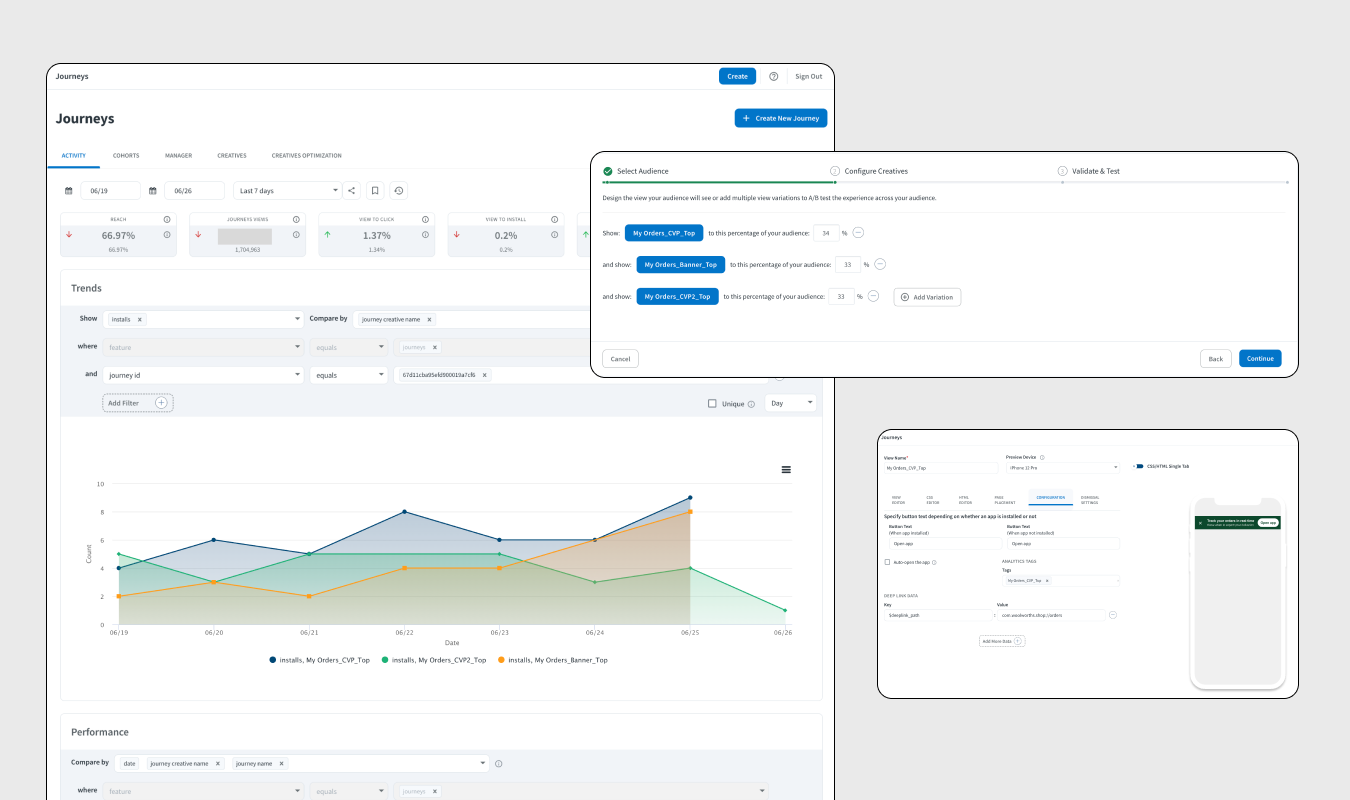
Behind the scenes – configuring the banners
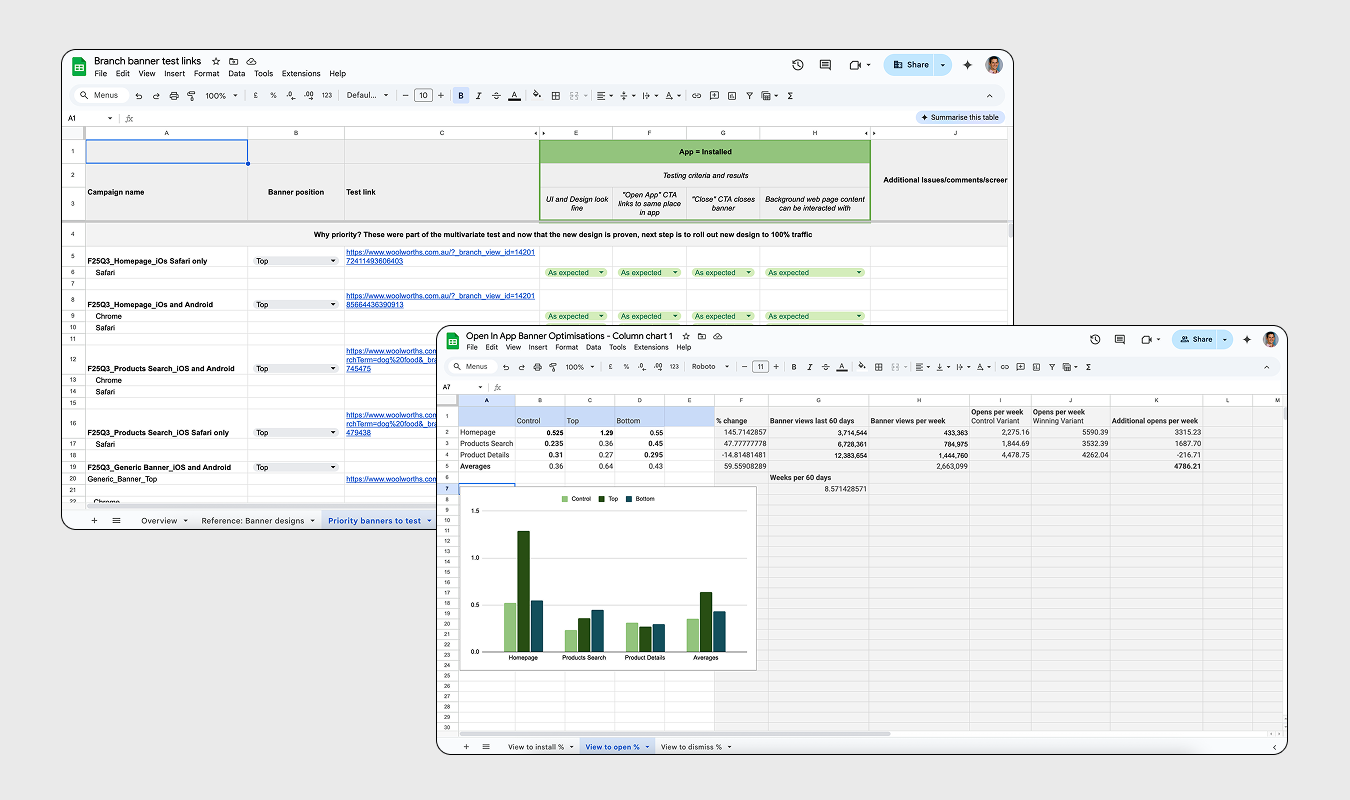
Crunching the numbers after 2 weeks of data